Progress report graphics
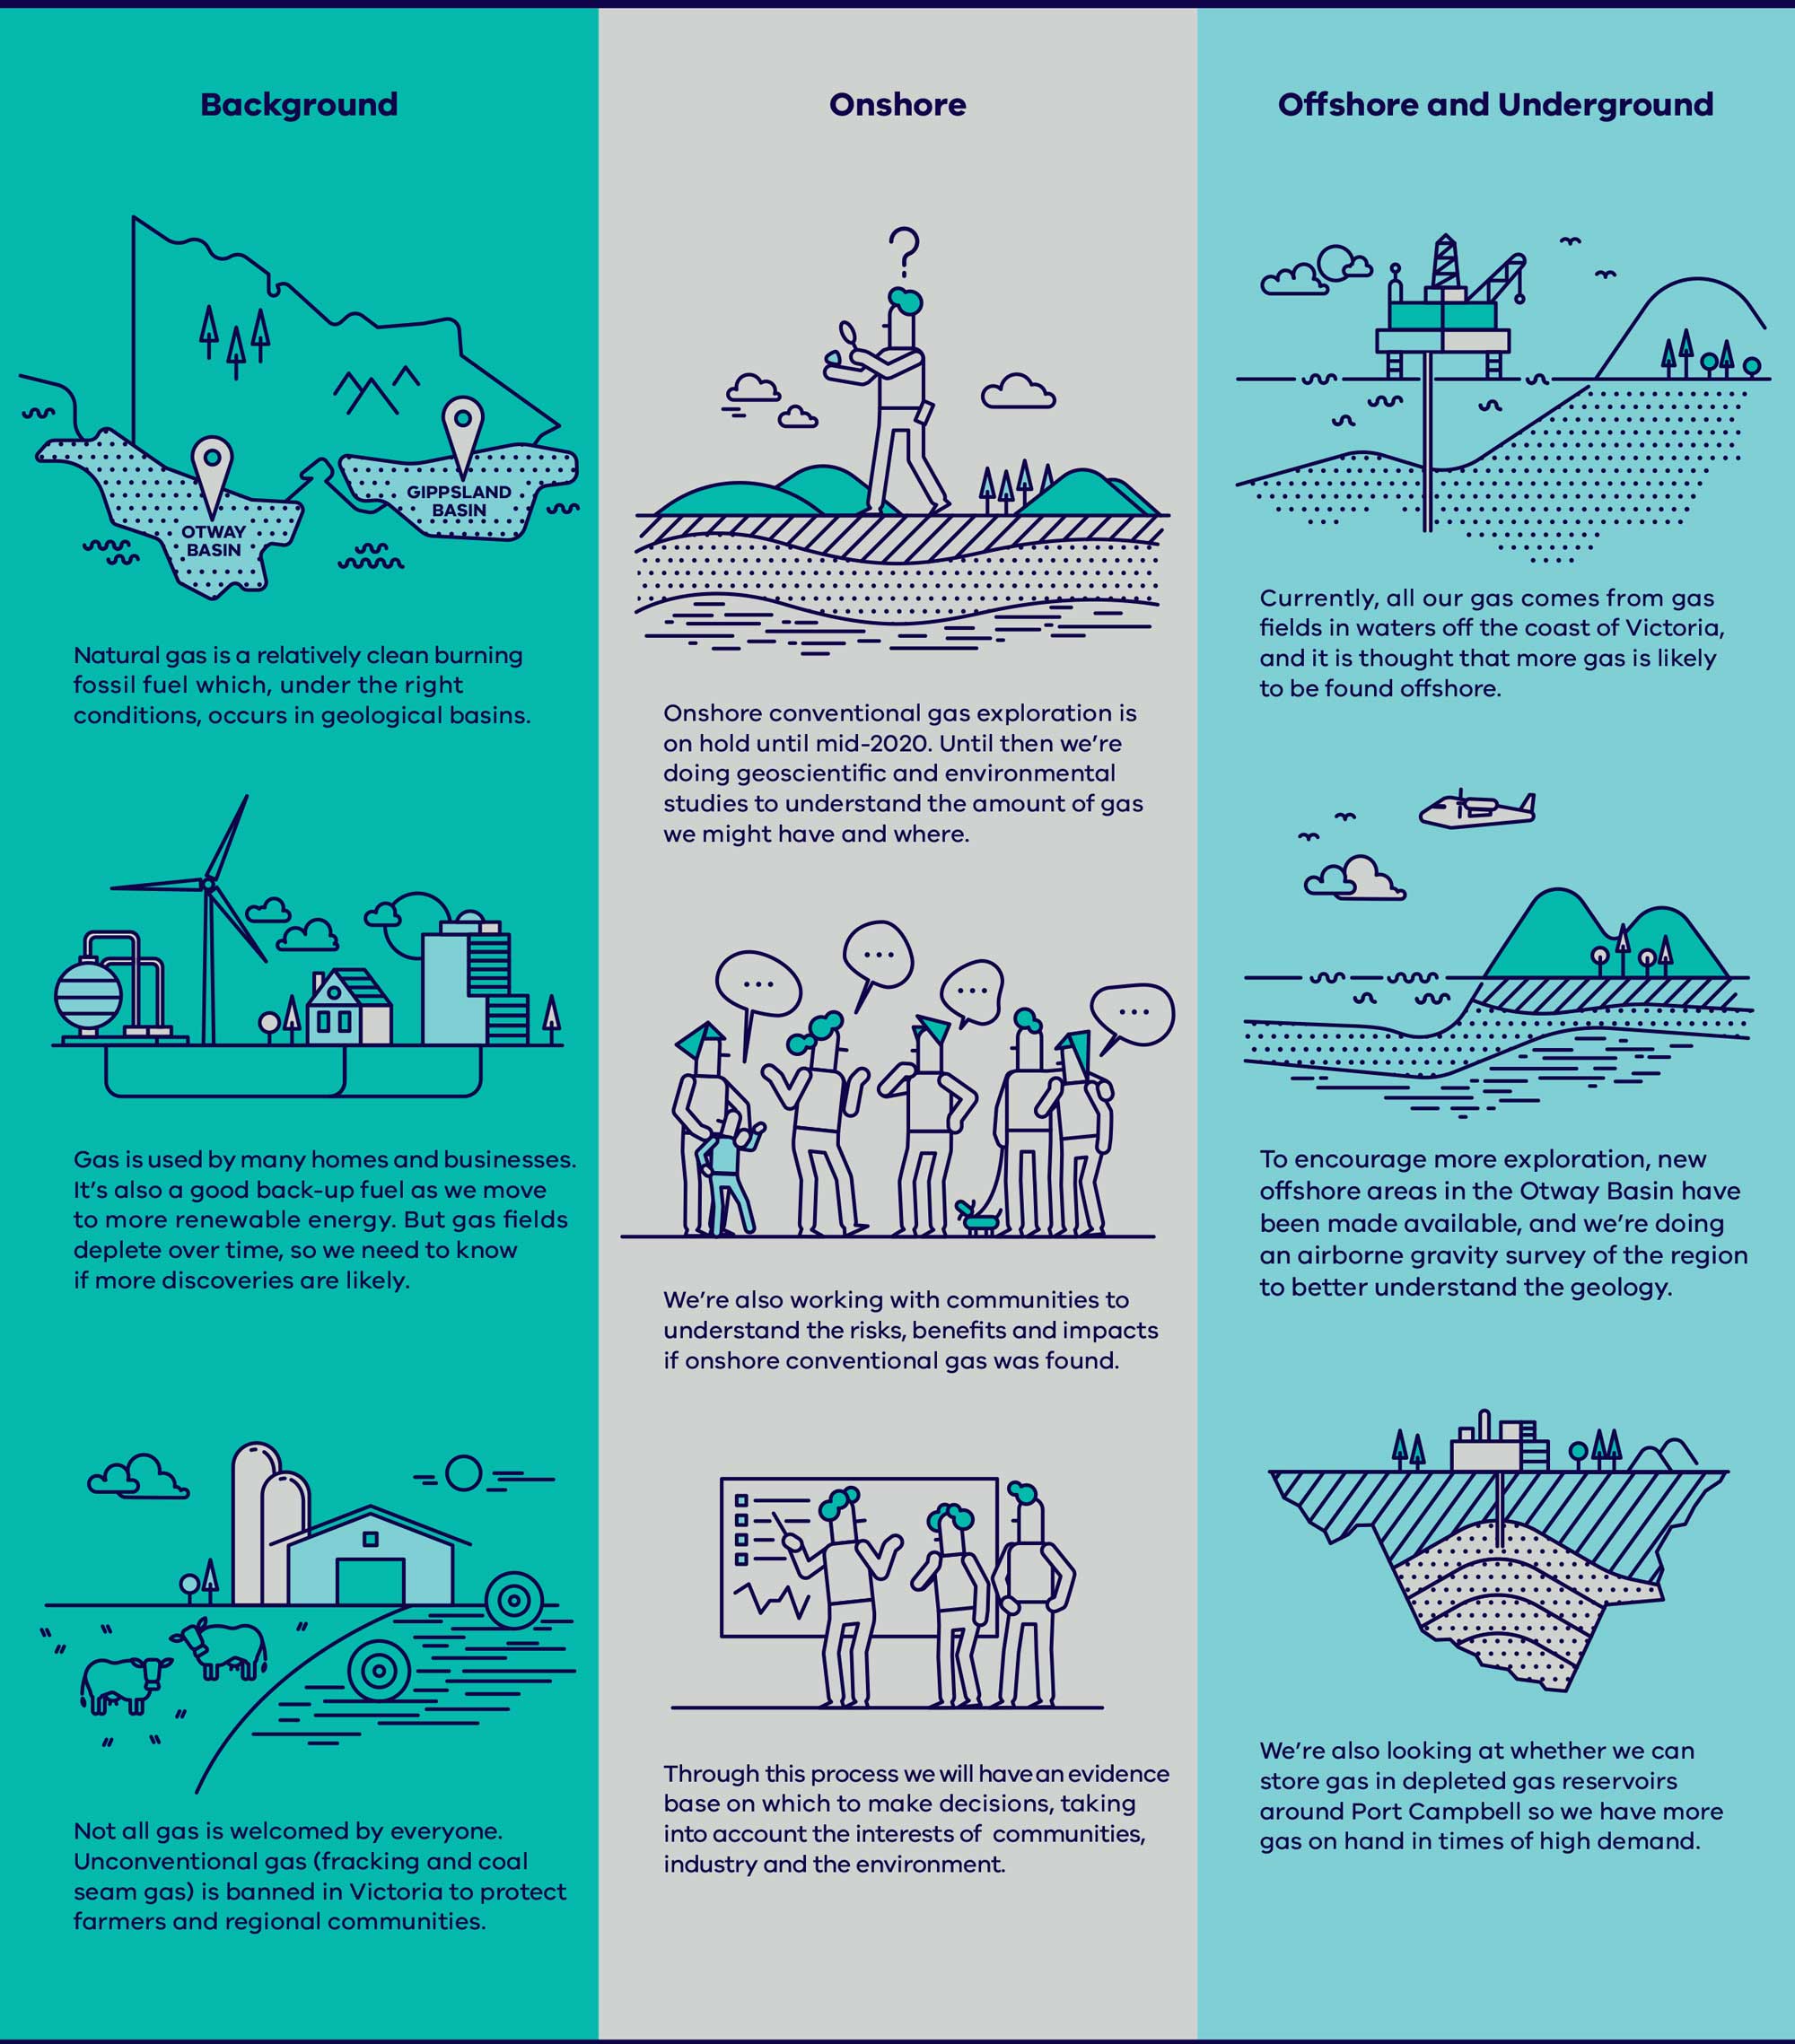
The Victorian Gas Program is a three year suite of geoscientific, environmental, technical and social studies. Infographics are periodically produced to show the progress of the program.
Click on the images to understand all the work-to-date behind the program.
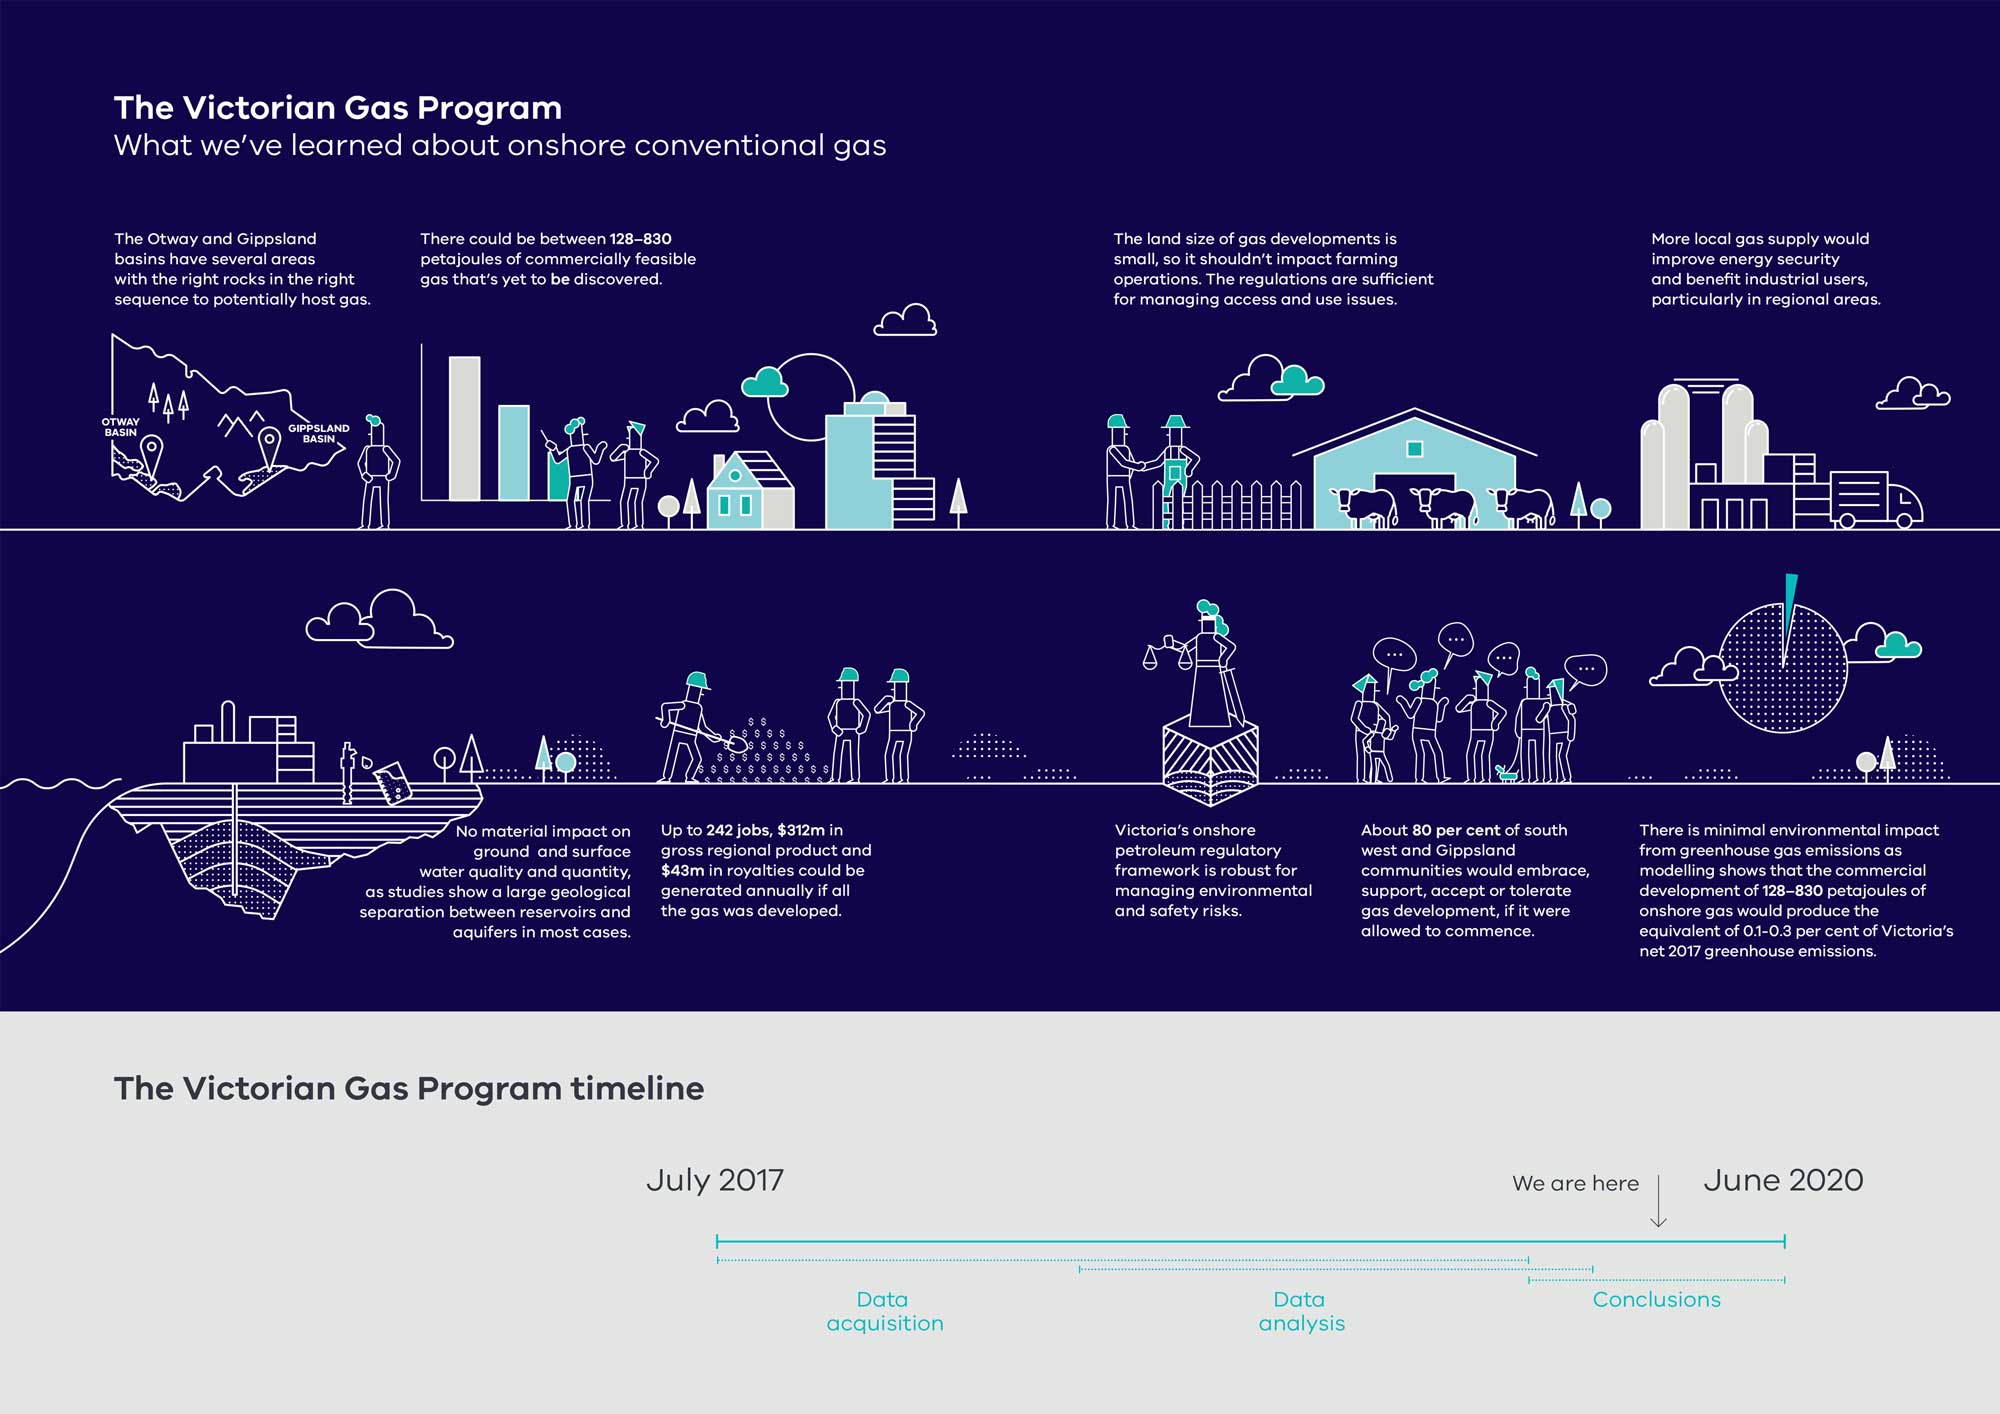
Report 4 Infographic, published March 2020:
Download the graphic ![]() [Image - 212.6 KB]
[Image - 212.6 KB]
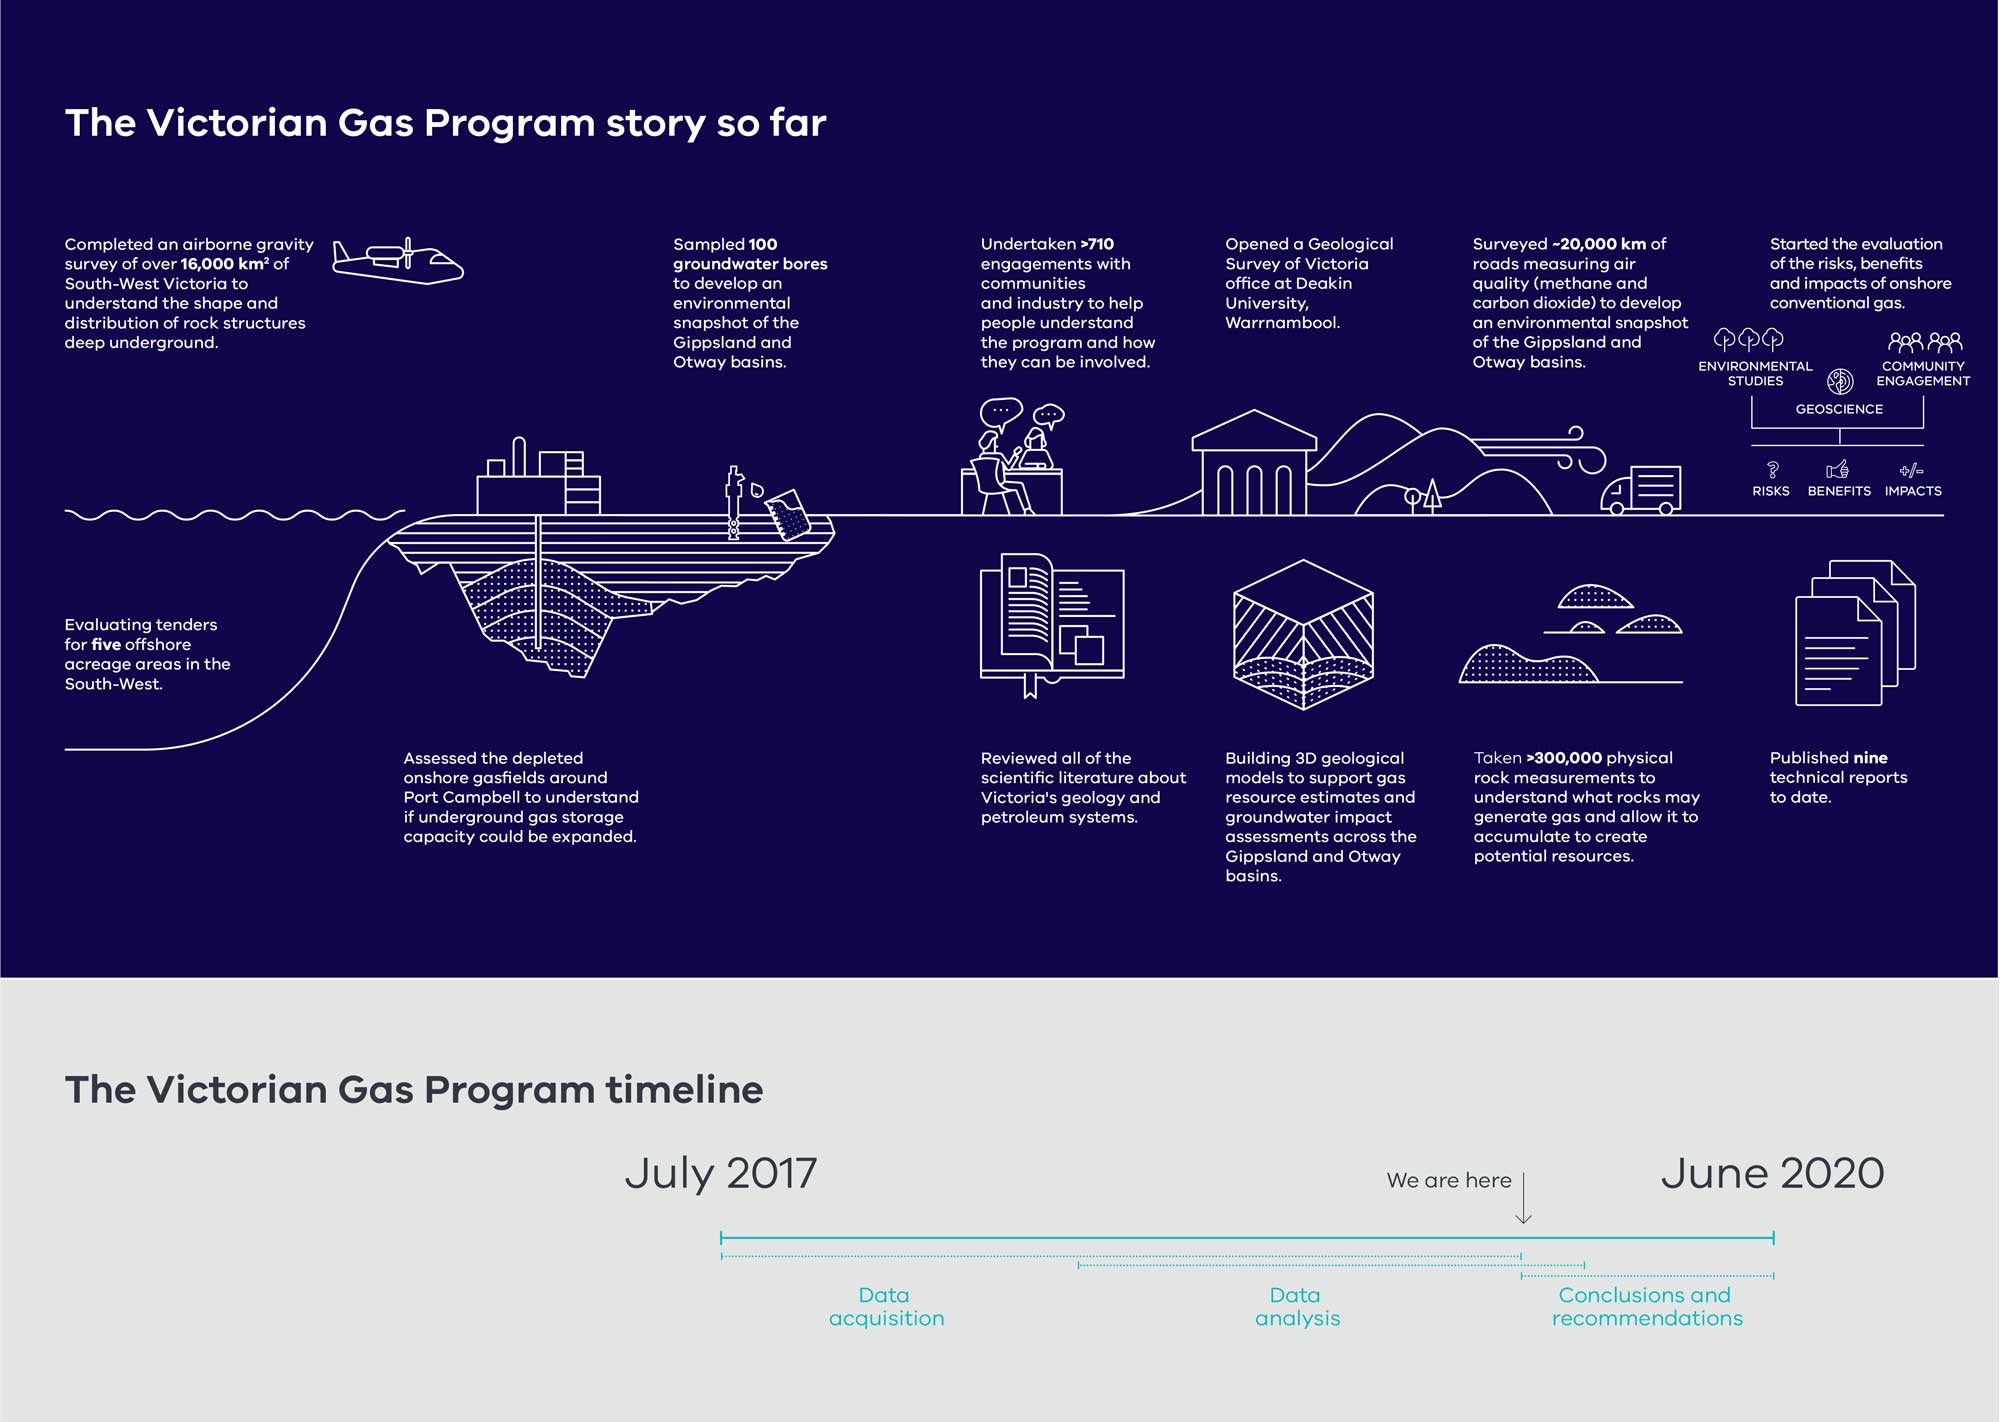
Report 3 Infographic, published October 2019:
Download the graphic ![]() [Image - 188.7 KB]
[Image - 188.7 KB]
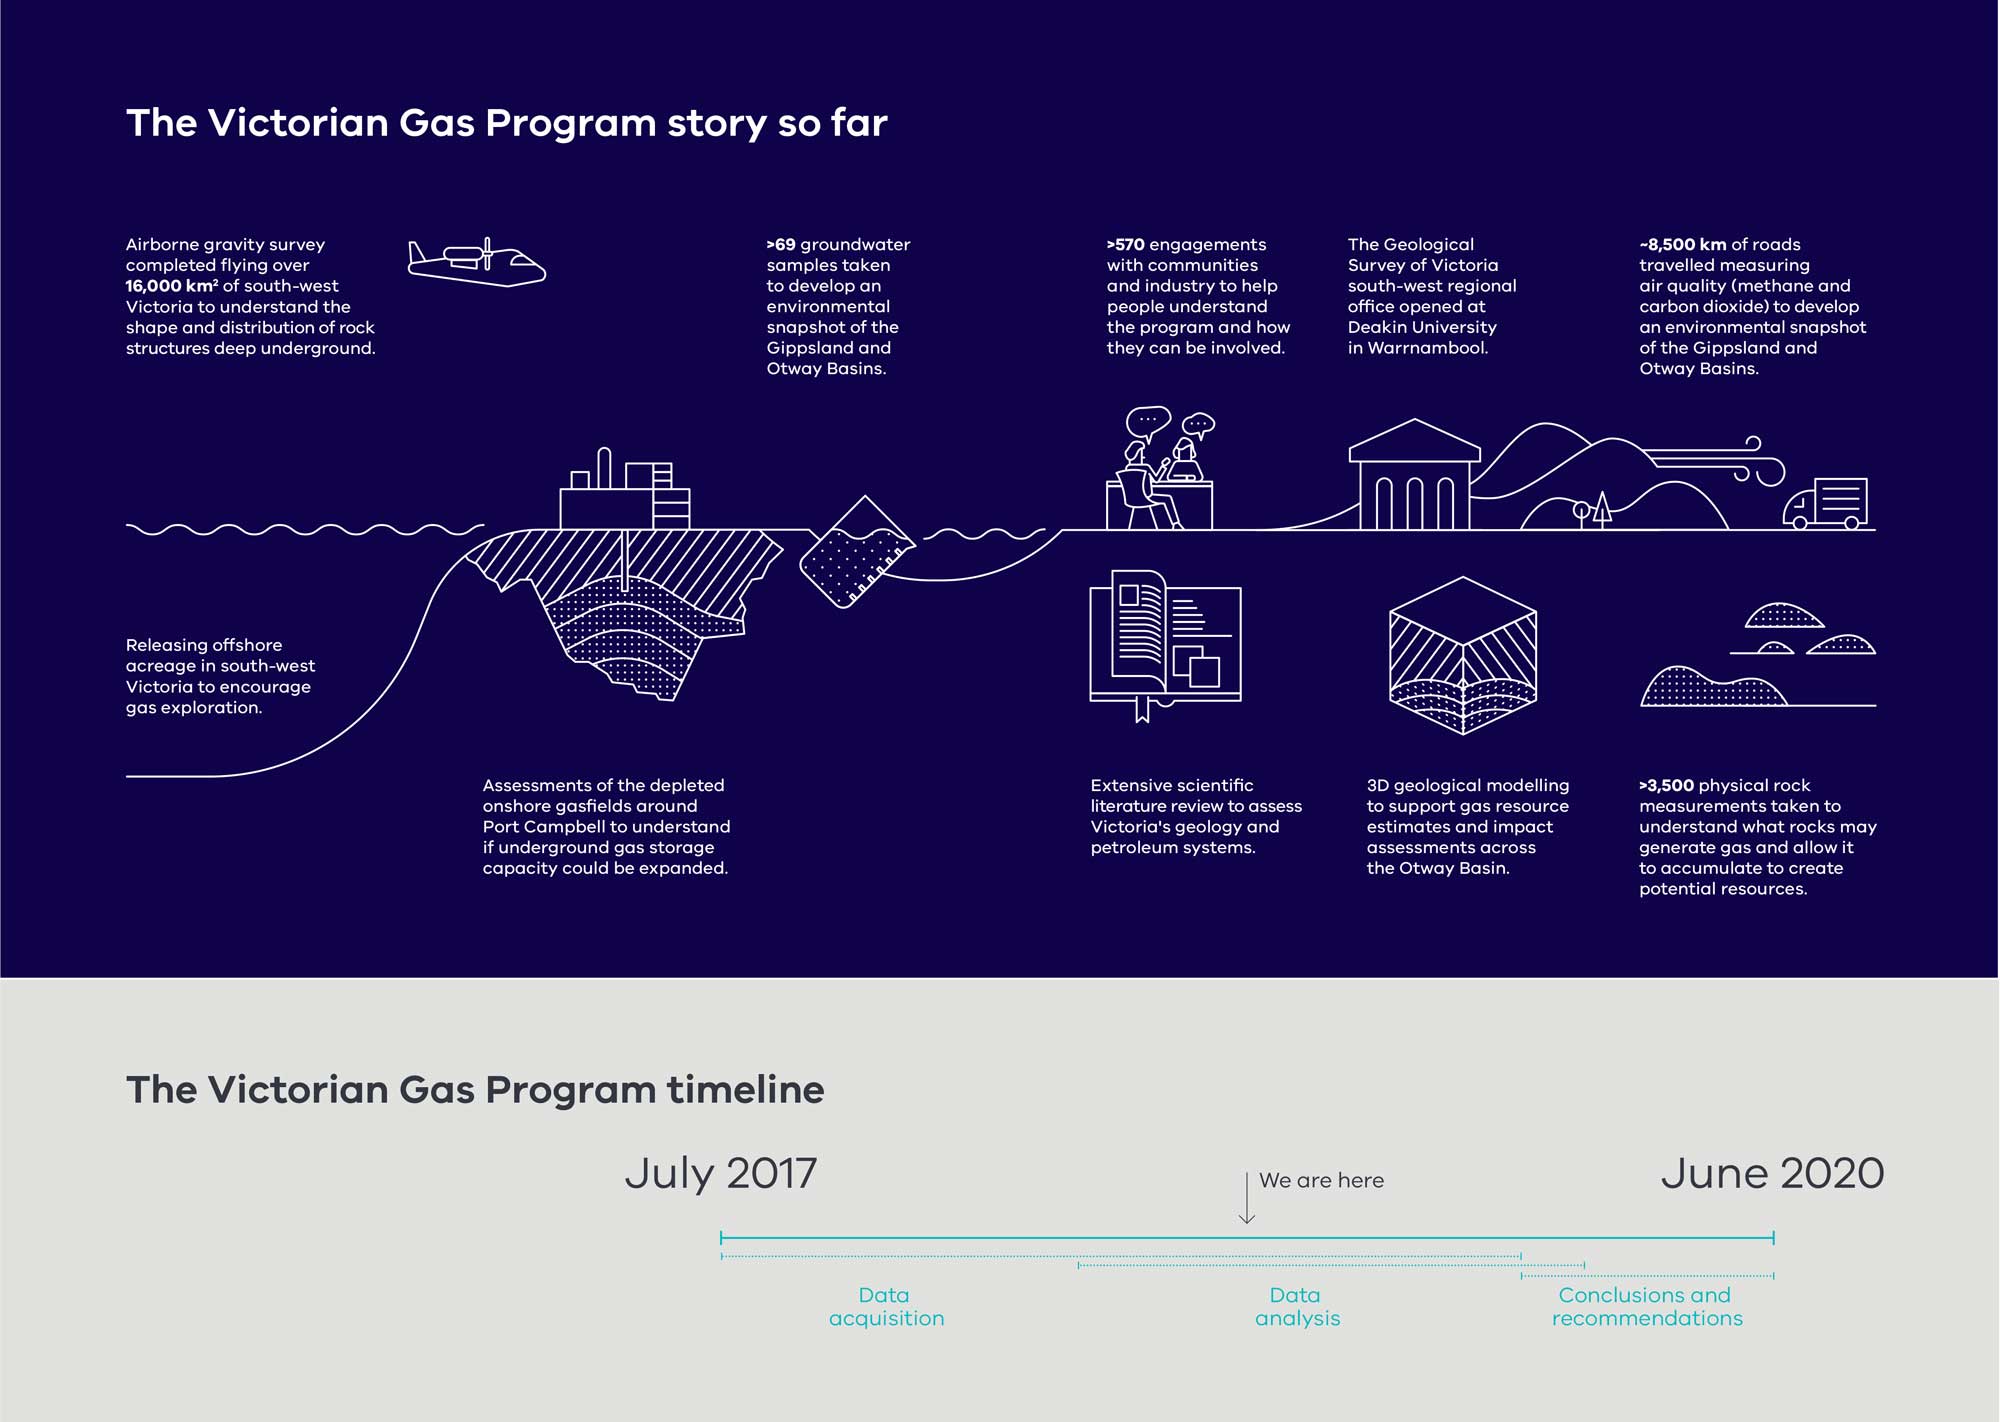
Report 2 Infographic, published February 2019:
Download the graphic ![]() [Image - 181.9 KB]
[Image - 181.9 KB]


